matlab 绘图添加竖线
2022年10月16日
matlab 绘图添加竖线
定义
在matlab绘制图片过程中,有时需要在图片中添加竖直的标记线来加强对比,下面介绍如何实现
方案
竖线
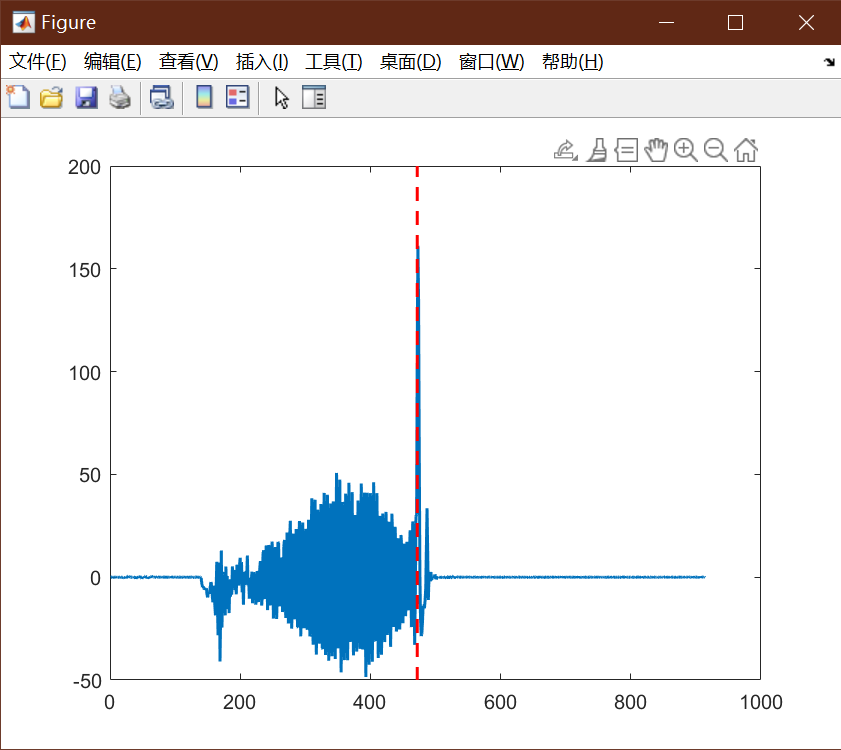
figure;plot(diff_vel_1); hold on; hh=axis;
plot([id_1,id_1],[hh(3),hh(4)],'r--'); hold off;
绘图结果为:

横线
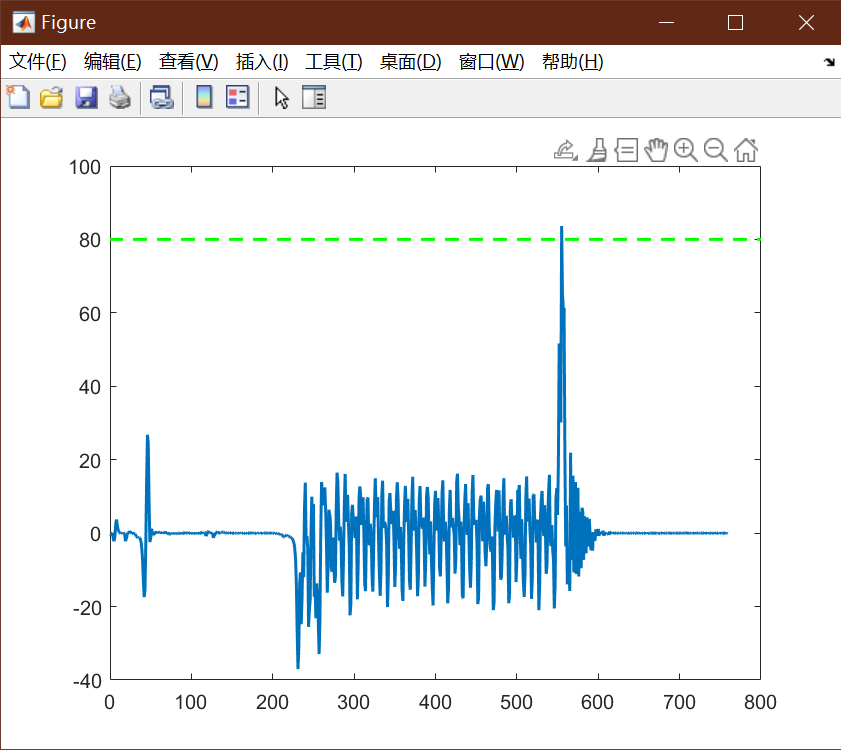
figure;plot(diff_vel_2,'LineWidth',1.5);hold on; hh=axis;
plot([hh(1),hh(2)],[80,80],'g--','LineWidth',1.5); hold off;

参考
引文
脚注
Loading...